The role of a project manager in a growing organization is to unshackle the executive team from the daily grind and let them focus on the big-picture and employees. It’s a pity to have them spend time addressing and resolving the day-to-day (or hourly) challenges inherent in projects. Microsoft Project Gantt charts resolve this issue. It helps them outline an effective way to create your initial project schedule and workflow by breaking down intricate projects into smaller, digestible tasks. This enhances assignability and clarifies team responsibilities. At the same time designing the entire project timeline in a visual format aids Project Managers in identifying dependencies between tasks and ensuring that they are completed in the correct order.

Microsoft Project Gantt Charts Overview
Named after Henry Gantt, who created it in the early 1910s, Microsoft Project Gantt Charts are still a staple tool in project management today. So, it doesn’t matter if you are a project management rookie or veteran, the Gantt chart is a term you’ve likely come across. While these charts might give you an initial aura of complexity, nothing is mystifying about it.
At a basic level, every Gantt chart consists of two main parts, a Grid or Task List on the left side that lists project tasks and important information about them and a Project Timeline on the right, showing a visual representation of the project schedule. The timeline lists the Start and End dates of project elements in a well-defined way. This helps you get a top-line perspective of a project and tasks related to it at a glance, including the order in which they begin and their duration.
Basic components of a Gantt Chart
- Task list: Positioned vertically along the left side of the Gantt chart, the task list itemizes project activities, often categorized into groups and subgroups.
- Timeline: Extending horizontally atop the Gantt chart, the timeline delineates the project’s duration, typically segmented by days, weeks, or months.
- Dateline: A vertical reference line within the Gantt chart indicating the current date, aiding in tracking progress against the project schedule.
- Task Bars: Horizontal visual elements on the right side of the Gantt chart representing individual tasks, displaying their duration, start and end dates, and progress.
- Milestones: Significant project events, such as key deliverables or reviews, denoted by yellow diamond markers on the chart.
- Dependencies: Light gray lines connecting tasks that must occur in a specific sequence, illustrating task interdependencies.
- Progress: Indicates the extent of completion for each task, often depicted by percent complete or shading within the task bars.
- Resource Allocation: Designates the individual or team responsible for executing a particular task, aiding in resource allocation and accountability.
Microsoft Project Gantt Charts Project Management Applications
- Planning and Scheduling: They help project managers plan tasks, schedule timelines, allocate resources effectively, and manage task dependencies.
- Progress Monitoring: By updating the chart regularly as the project progresses, stakeholders can track whether tasks are on schedule, behind, or ahead of schedule.
- Communication: Gantt charts are valuable tools for communicating project plans and timelines to team members, stakeholders, and clients in a visually engaging and understandable format.
How to create a Project Plan with Gantt Charts?
Let’s create a Project Plan from scratch with Microsoft Project.
All you need to create a Gantt chart are the tasks’ names along with their corresponding start and end dates.
Click that shiny project icon on your Taskbar.
Allow the application to load while its animation appears on the screen.

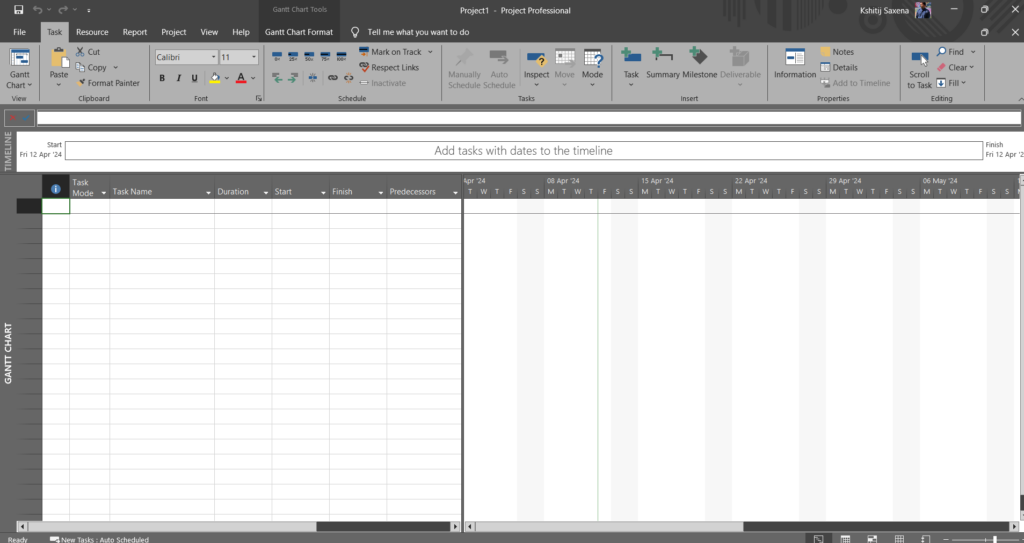
After the application launches, you’ll be greeted with the interface featuring various tabs at the top.
Click on the “File” tab to choose from pre-existing templates or project plans. Templates work if you prefer not to start from scratch.
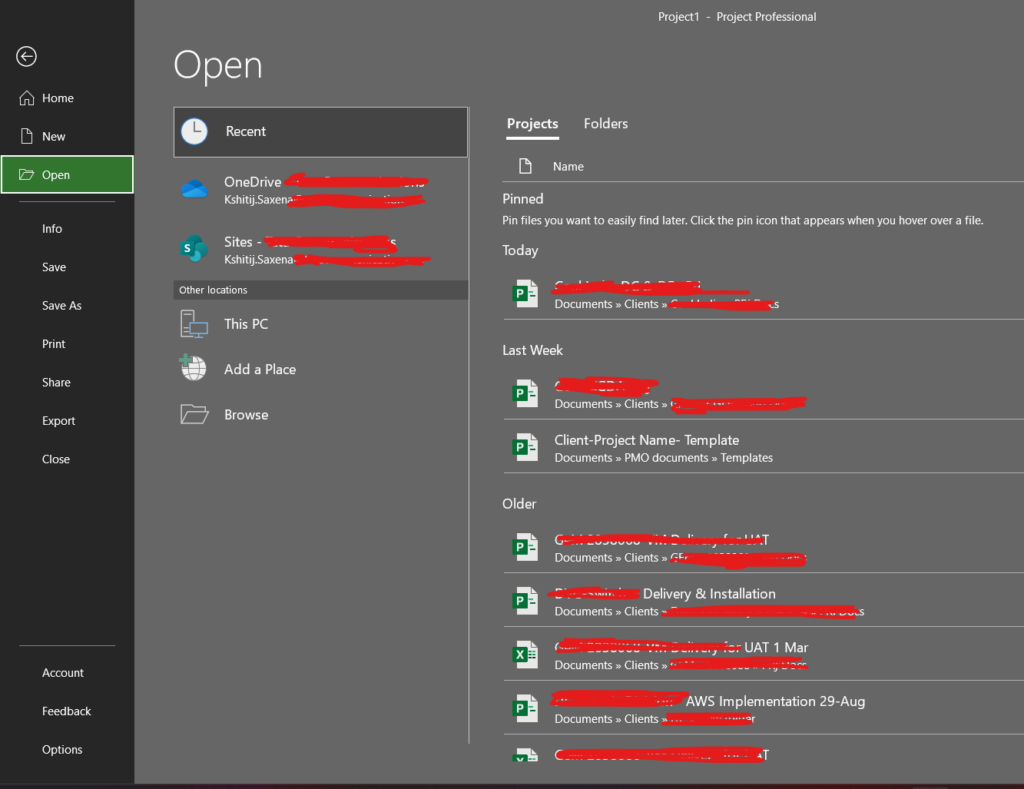
For a quick start, select a template. Upon selection, all tasks included in the template will load instantly.
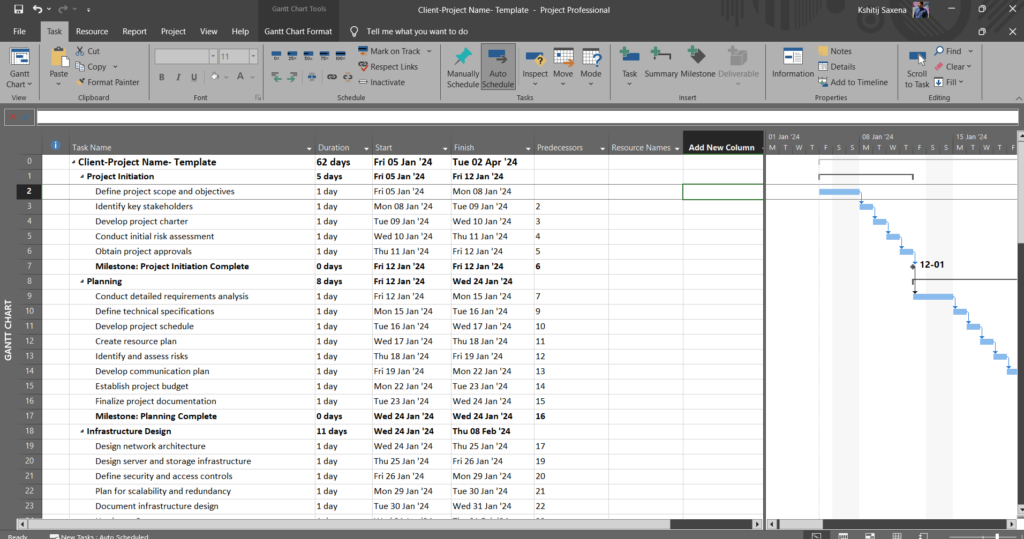
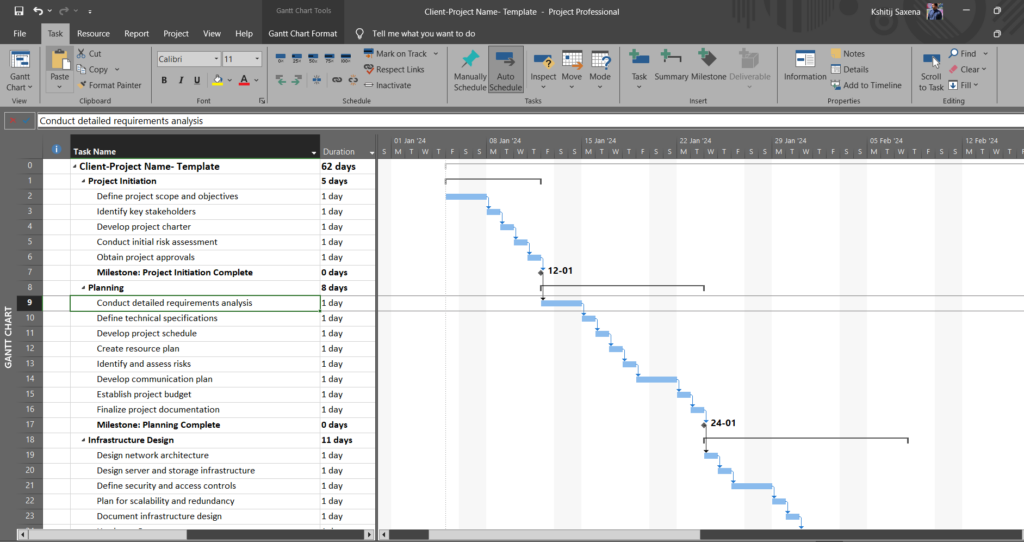
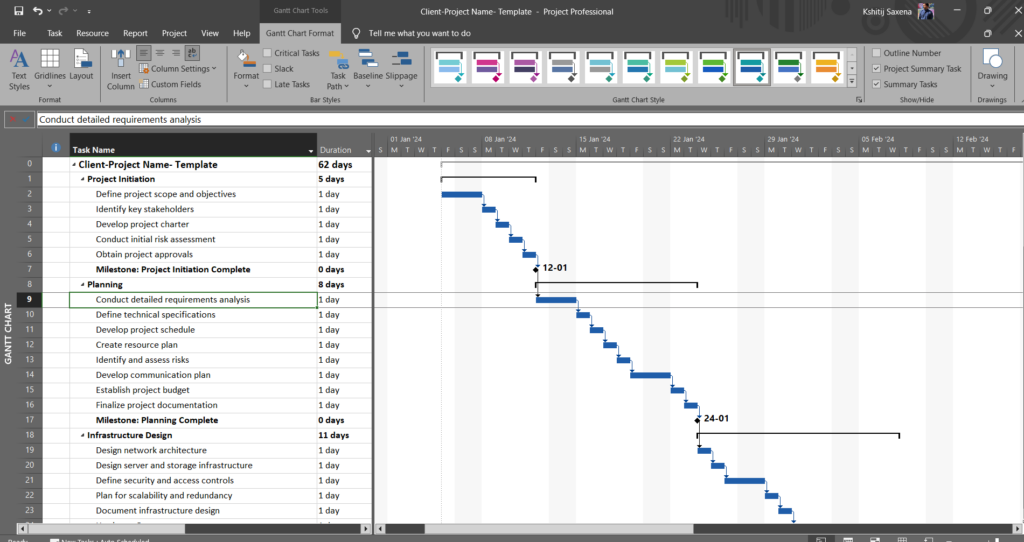
The spotlight will now shift to the Gantt Chart view. Tasks with names under a project will show up along the Y-axis of the Gantt Chart, while their durations are plotted along the X-axis. Each task will be represented by a bar, with the length of the bar correlating to its duration. You’ll also see the Start and Finish dates, Dependencies, and Resources. This visualization method facilitates a clear representation of task lists and their interrelations..
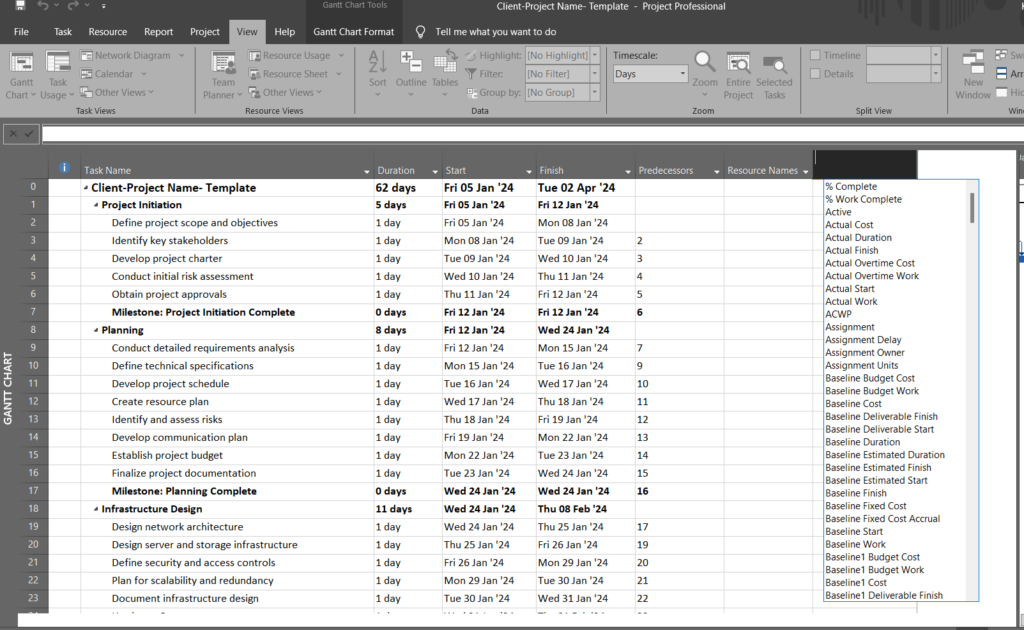
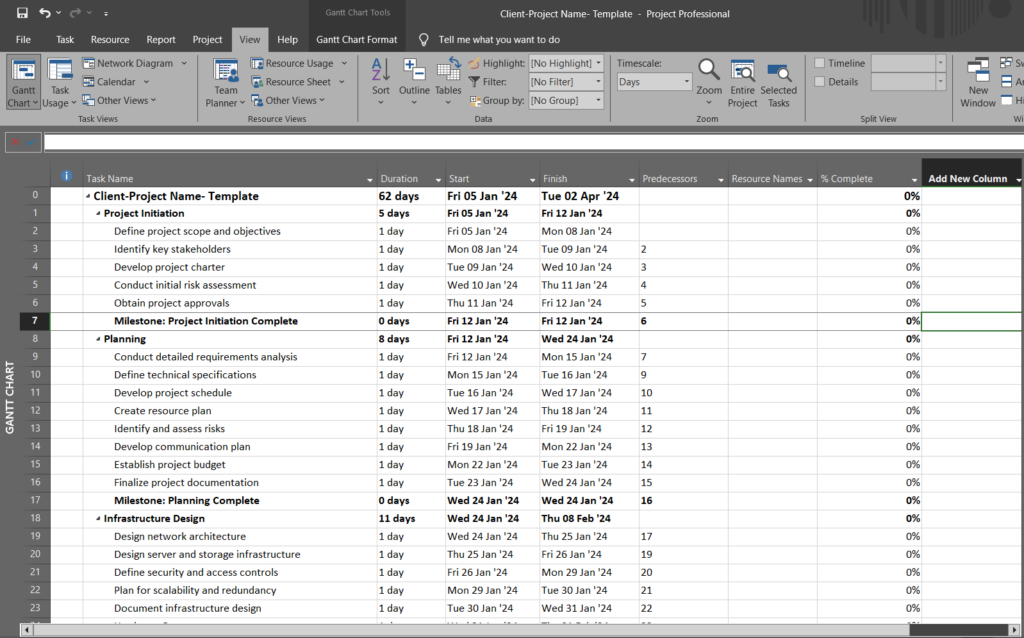
If you need to add more columns to the Gantt Chart, simply use the dropdown menu to select from pre-defined options or create custom columns.
For example, we’ve added a “% Complete” column to monitor task progress, which can be updated by the project manager based on task owner feedback.
Customize the Gantt chart colors and apply conditional formatting to add glitter to your timeline. You can make your project plan more engaging and interactive.
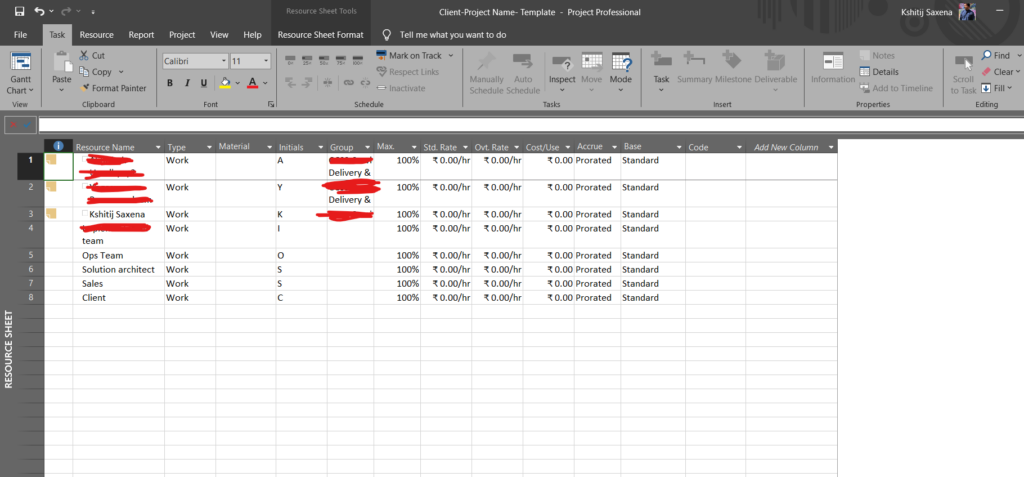
You can click on the Resource sheet tab and navigate to the resource sheet view. Quickly add resources and assign tasks to them and then keep tracking until their completion.
Microsoft Project Plan Professional also features robust reporting capabilities. You can utilize built-in reports for quick insights and sharing with management or create custom templates for detailed reviews.
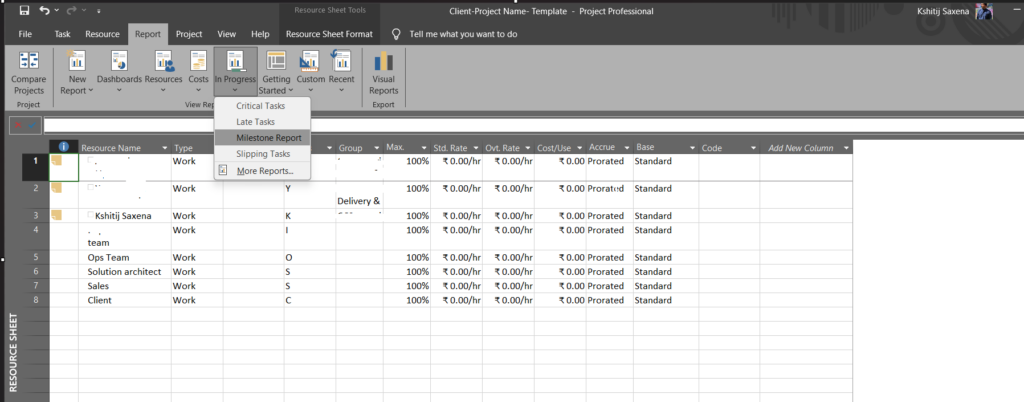
To access reports, click on the “Report” tab and navigate to the milestone report. This report highlights upcoming milestones and the completion status of associated tasks over the coming weeks.
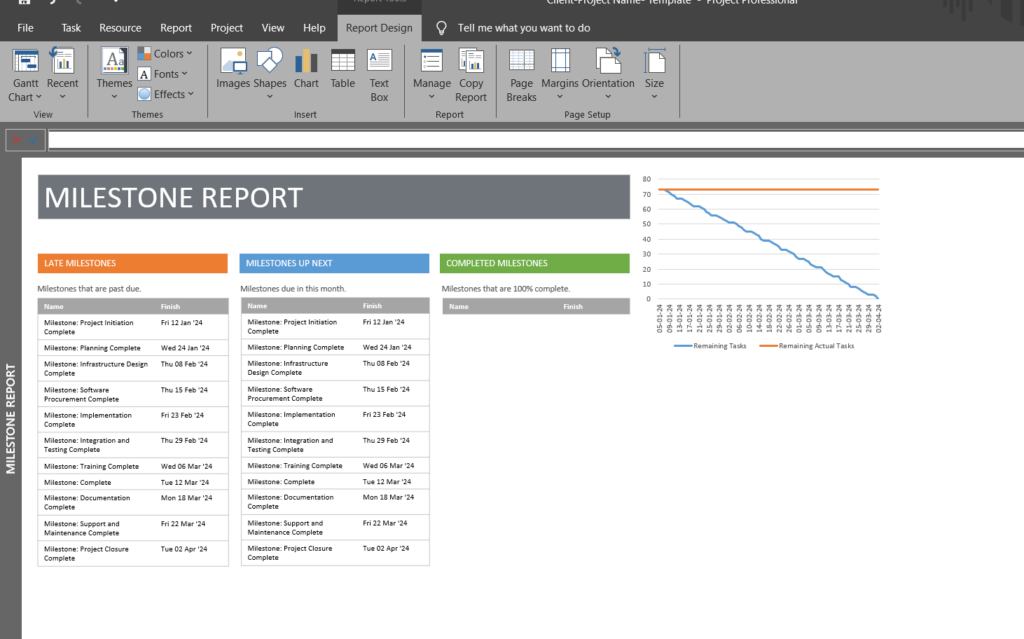
Thus, a large part of project completion can be addressed by collaboration among team members and stakeholders through Gantt Charts. Its project outline is known to facilitate comprehensive project planning like project scheduling, resource allocation, and budget management.
Conclusion
The functionalities and attributes outlined in this piece barely skim the surface. Stay tuned for a deeper exploration of the myriad features in forthcoming articles. So, next time you’re knee-deep in project chaos, remember: Gantt charts are your resume tool. They’ll guide you through the jungle of deadlines, resource clashes, and surprise dance-offs.
We trust this article equips you with the essential knowledge. So, launch your project and oversee its advancement. Explore its features until your envisioned outcome—be it a product, service, or targeted achievement—is realized.